
2018 Fourth Quarter Market Report
Our local real estate market took some interesting turns in 2018, as the frenetic conditions of the first half of the year gave way to a more balanced environment in the third quarter. Data for the fourth quarter of 2018 has arrived, so before we turn our attention to the new year and what lies ahead, let’s take a look at the market trends that closed out 2018.
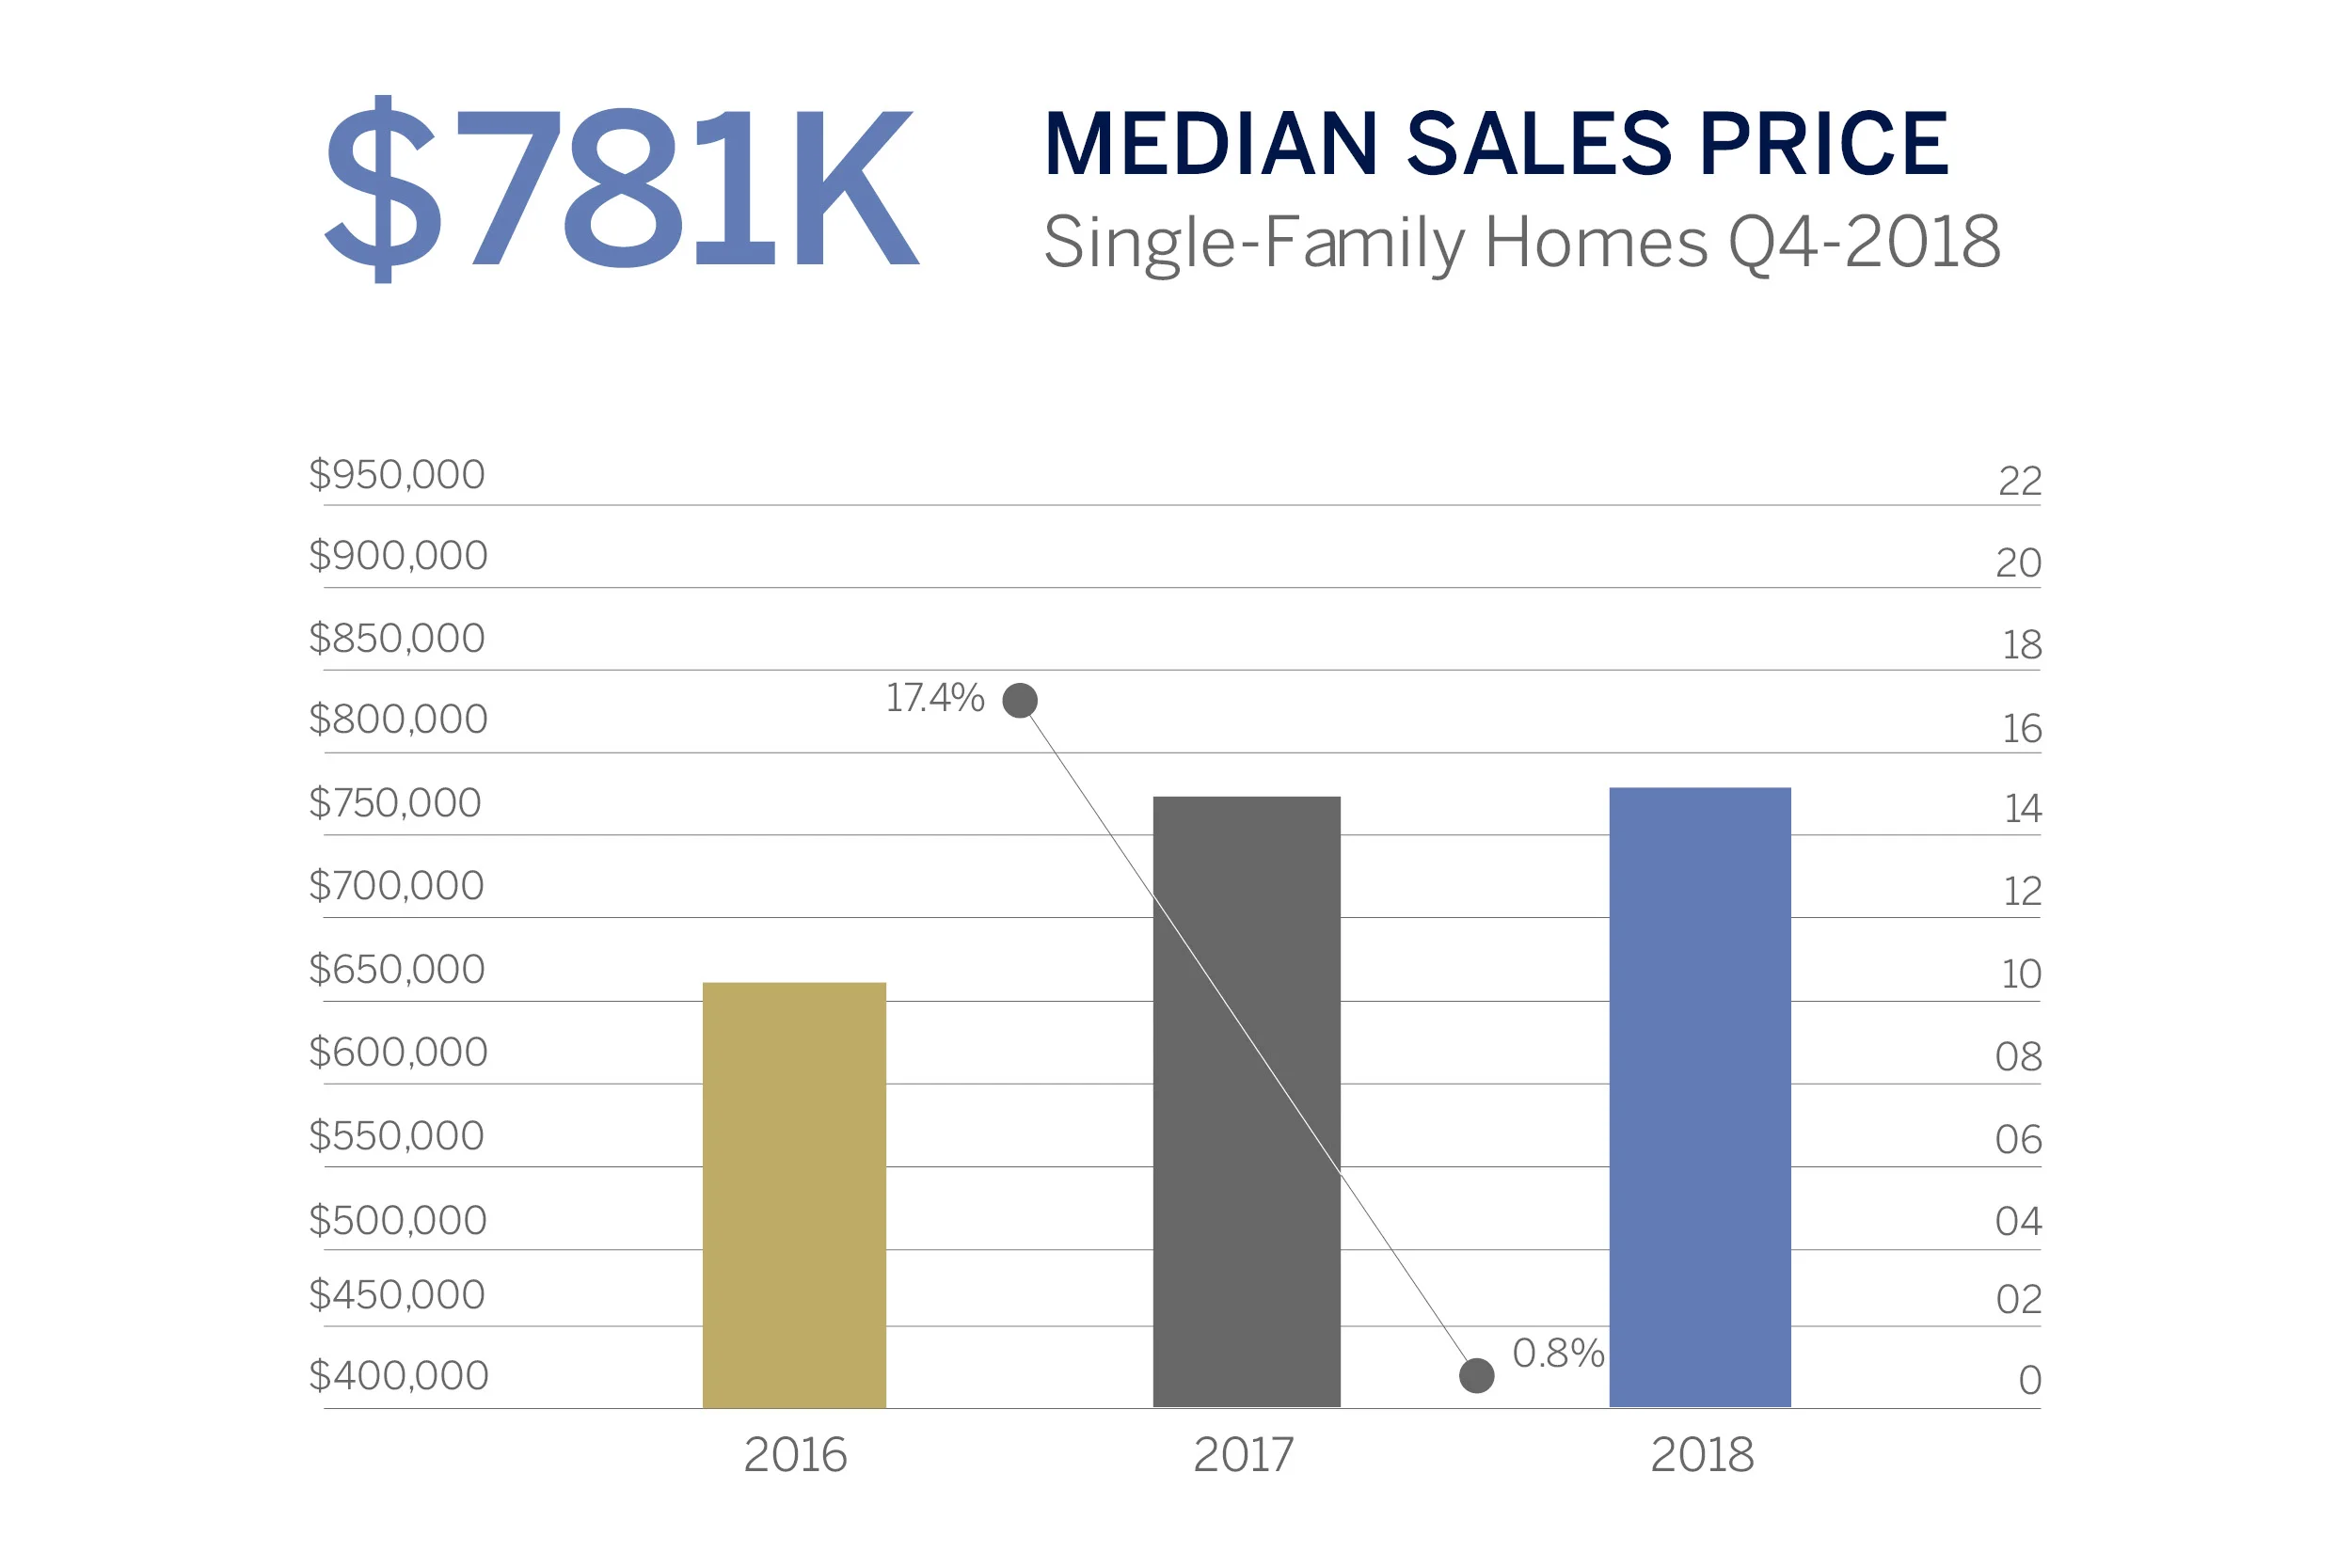
Seattle Single-Family Homes
Though inventory waned from the high of 2.1 months reported in Q3-2018, the shift was dramatic on an annual basis, moving from the low of 0.4 months of inventory in the fourth quarter of 2017 to 1.5 months in the final quarter of 2018. Both the median sales price and average price per square foot for single-family homes in Seattle held relatively steady from Q4-2017 to Q4-2018, with the median sales price increasing from $775,000 to $781,000, and the average price per square foot growing from $435 to $441.
The average cumulative days on market hovered just above one month, a substantial increase compared to the summer months of the third quarter, when we typically see a seasonal pick-up in activity. It also grew drastically—by 73.7 percent—when contrasted against the final quarter of 2017, when homes sold in an average of 19 days.

Seattle Condominiums
As was the case in Seattle’s single-family market, the rise in inventory—from 0.2 months in Q4-2017 to 2.2 months in Q4-2018—did not alleviate home price growth or average price per square foot in the condominium market. The median sales price grew by 8.4 percent from the fourth quarter of 2017 to the fourth quarter of 2018, at $441,000 and $478,000, respectively. The average price per square foot grew at a slightly lesser pace of 5.8 percent, from $549 to $581.

Eastside Single-Family Homes
Turning to the Eastside, record-breaking home price growth continues to moderate, with Q4-2018 reporting the lowest median sales price of the year, at $860,000. On a quarterly basis, home values appreciated 3.5 percent from the fourth quarter of 2017, when homes sold for an average of $831,000. As one would expect, increasing median home prices translates to growth in the average price per square foot, which moved from $349 in Q4-2017 to $372 in Q4-2018. As is often the case during the fourth quarter of any year, the number of home sales slowed, as some buyers took a break from their home searches over the holidays.

For the full report and look at statistic trends, head to the RSIR blog: Market Trends From Around the Sound.